
Previous Period Comparison on One Chart
On 10 Nov 2026 I opened the Apps cards and the humans line for eventda.sh was only the current week. The dashed line beside it was the week before, same color, lighter. A previous period comparison is those two windows on one chart. They are the same length. Day one of the earlier window sits under day one of this one.
The percent next to a total is the two sums. The line is which days moved. A quiet previous week and a Thursday spike can share one badge. They do not share a shape.
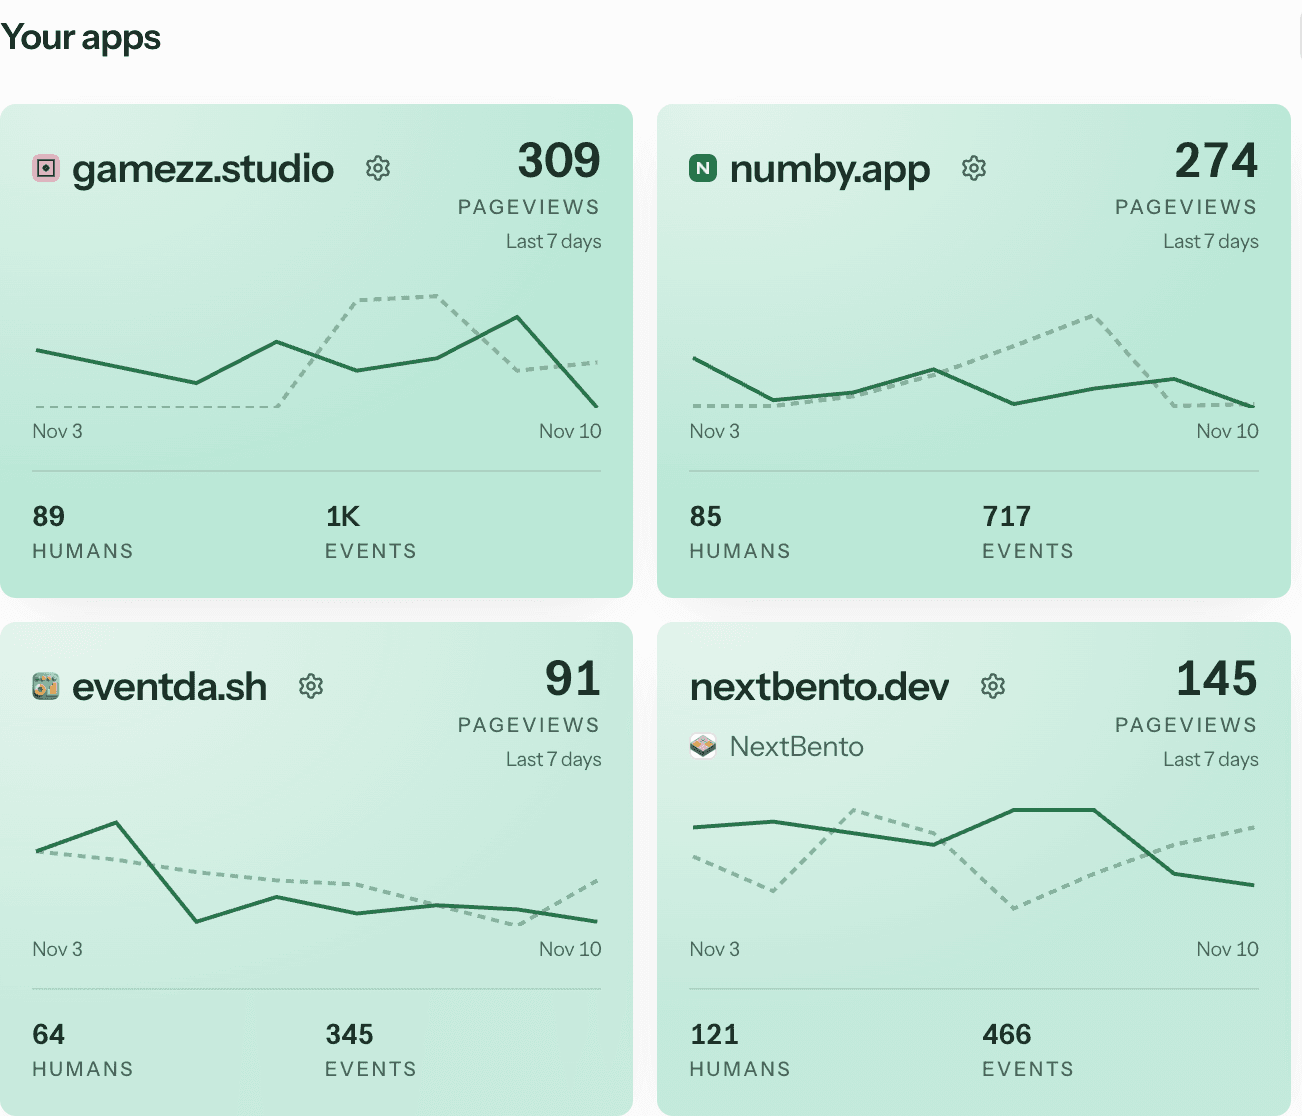
Humans on the Apps cards
The range control is 7D, 28D, 3M, 6M, and 12M. 28D is the default. The shot above is 7D, so the axis runs Nov 3 to Nov 10. eventda.sh showed 91 pageviews, 64 humans, and 345 events. The big number is pageviews for this window only. The solid line is humans. The dashed line is humans for the same number of days immediately before.
There is no second axis and no year-ago overlay. If the earlier window has no points, the dashed line stays off. Hover a day and the tip names previous humans with that earlier date, so the axis label stays this window.
Search Console on the SEO cards
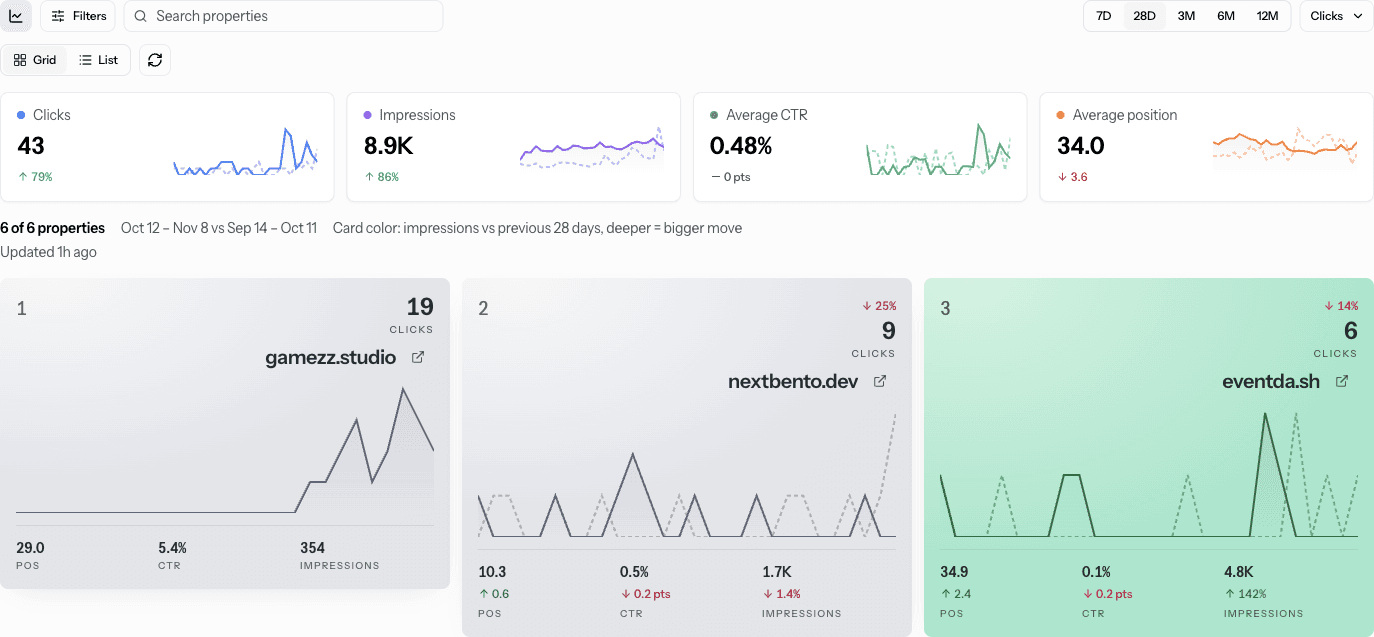
The SEO page uses that overlay for the metric you picked: clicks, impressions, CTR, or position. On 10 Nov the range was 28 days, Oct 12 to Nov 8, against Sep 14 to Oct 11. The end date sits about two days back. That is the Search Console lag I keep hitting on our own property, not a hole in the chart.
The portfolio cards summed to 43 clicks, up 79%, and 8.9K impressions, up 86%. CTR was 0.48% and flat. Average position was 34.0, and the 3.6 beside it moved the wrong way. A higher position number is worse. eventda.sh itself was 6 clicks, position 34.9, CTR 0.1%, and 4.8K impressions. The dashed line is that same metric for the previous 28 days. Nothing is filled under it.
Google's comparison filter lines two ranges up the same way, and the Performance report is still the click source. We do not invent a second count. A dashed line next to a commit pin is still not a cause. The Search Console join and the GitHub pins stay separate jobs.
Apps and SEO in the sidebar
The platform list used to say Overview and SEO overview. It now says Apps and SEO. Apps is /dashboard. SEO is /dashboard/seo. Inside an app, the Platform group lists Apps above SEO. The workspace tab on that app is still Overview. The old apps list at /dashboard/apps redirects to /dashboard. An app URL with an id did not move.
What the chart will not do
There is no year-over-year switch and no custom second range. The previous window is always the same number of days, sitting immediately before. Empty previous data means no dashed line, not a zero line that pretends the site was dead. Position uses the same scale as the solid series. A missing position is a gap, not rank 1.
Search Console setup is in the SEO docs. That tab is what SEO teams open when the question is clicks, not just pageviews.
Read both lines
Start free and open Apps. The dashed humans line is on every app card that has a prior week. SEO is the same idea on clicks, impressions, CTR, and position. Pricing is the plan split if you want Search Console on that chart.
Sources
- Performance report (Search results) (Google Search Console Help)
- Performance report: Advanced filtering and comparison (Google Search Console Help)
Related
Key takeaways
- Previous period comparison draws the prior window as a dashed, lighter line on the same chart. Day one sits under day one.
- The range control is 7D, 28D, 3M, 6M, or 12M, and 28D is the default. Solid is humans. Dashed is the window just before, same length.
- SEO cards use that overlay for clicks, impressions, CTR, or position. Search Console still ends about two days back.
- The platform labels are Apps and SEO. The workspace tab inside an app is still Overview.
FAQ
- What is a previous period comparison?
- A previous period comparison in EventDash draws the window just before the one you are looking at, as a dashed line on the same chart. The windows are the same length. Day one of the earlier window sits under day one of the current window. The solid line is this period. The dashed line is the one before it.
- What do the Apps cards compare?
- The Apps cards take the range you pick: 7D, 28D, 3M, 6M, or 12M. 28D is the default. The solid line is humans for that window. The dashed line is humans for the same number of days just before it. The pageview total stays on the current window. On 10 Nov 2026, with 7D selected, eventda.sh showed 91 pageviews, 64 humans, and 345 events.
- What did the SEO cards show on 10 Nov 2026?
- The SEO cards draw the metric you selected: clicks, impressions, CTR, or position. On 10 Nov 2026 the portfolio was 28 days, 12 Oct to 8 Nov, against 14 Sep to 11 Oct. Totals were 43 clicks, up 79%, and 8.9K impressions, up 86%. CTR was 0.48% and flat. Average position was 34.0, with a 3.6 move the wrong way.
- Can I compare this range to last year?
- No. The previous window is the same number of days immediately before the current one. There is no year-over-year switch and no second range you pick by hand. If that earlier window has no points, EventDash skips the dashed line instead of drawing a fake zero.